Most people are terribly unhappy. There is plenty of data and anecdotal evidence to support this. It should be plain that the average person is miserable. They are lonely, overweight, broke, stressed, sick, depressed, anxious, and apathetic.
How much joy is it possible to have, and how many people encounter more than average? Perhaps it seems that it is impossible to say, since joy is not as externally measurable as something like wealth.
The key is to understand that joy is one of many Pareto-distributed attributes.
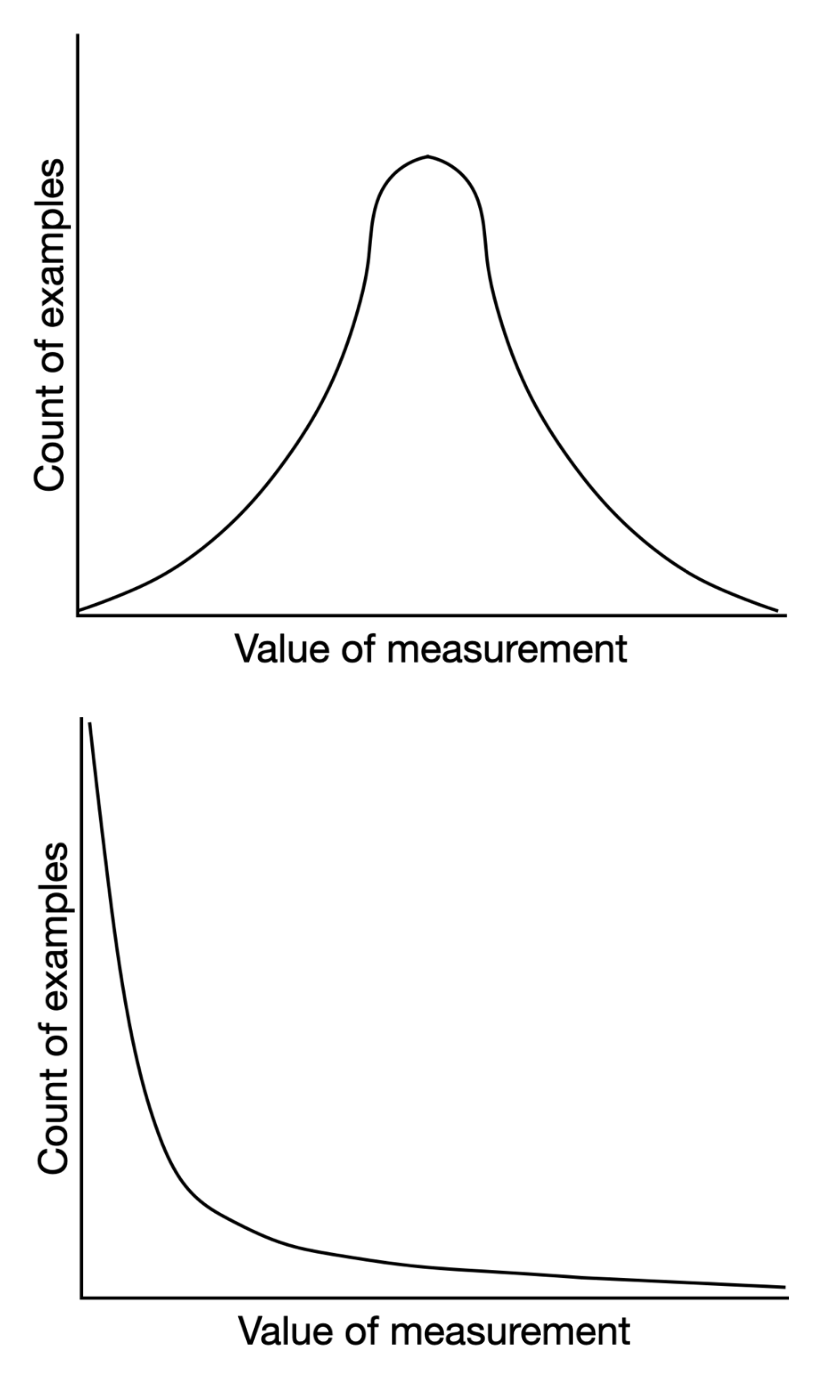
The measurement of the range and count of a property across a population is called a distribution. While uncountable properties exist across reality, they tend to recur according to only a few patterns. By naming and recognizing these patterns, we are able to instantly ascertain a great deal of information about what would otherwise be a poorly understood situation.1 Distributions can be graphed using a curve that increases or falls based on the count of people with increasing amounts of whatever is being measured as you go from left to right.
The Pareto distribution has most of the area under the curve over by the low end of whatever is being measured, and the curve drops speedily to near zero shortly thereafter. Most people have heard of this distribution, whether by name or property, but everyone has seen it in action. Sometimes it is described as the 80/20 rule, and examples are found in many cases in nature and human behavior. For example, most earthquakes are of low magnitude, most traffic occurs on very few of the total set of roads, a small set of the salespeople make most of the sales, 80% of car accidents are caused by 20% of people, 80% of time spent watching movies comes from 20% of movies, and most famously, 80% of wealth is held by 20% of people.
Research will show that every outcome determined by human choice based on perceived value results in a Pareto distribution of results. With this in mind, though we can’t directly measure the distribution of human joy, we can accurately predict it. It will follow the same distribution as human wealth. This isn’t to say that those who are poor in money will be poor in joy and vice versa, but that we should expect that the magnitudes and spread of joy among humans will be similar to how money is distributed among people.
What does the wealth distribution look like in magnitude and spread? In 2020, Elon Musk was 1.5 million times more wealthy than the average middle class American2 and 378 million times wealthier than most Americans, who are poorer than that.3
If joy is Pareto distributed, it can provide us a clue as to how much joy it is possible to have. If joy is Pareto distributed, 80% of the joy is experienced by 20% of the people, while most people have hardly any joy at all.
The proposed extremity of the limits of joy may seem exaggerative, but it is no harder to believe than the extremities of wealth. If wealth and joy are distributed according to the same pattern, it is possible to be many thousands of times more joyous than the average person and that the “most joyous” person may be millions of times more joyous than the average person! It is not unreasonable to suppose that the most joyous person is as joyous as the summed joy of many other people, just as Musk had as much money in 2020 as the sum of 378 million average Americans. Just think about that.
Footnotes
- 1. Most people are familiar with the Normal distribution, or Bell curve. It is a rounded triangle shape, meaning for whatever property discussed, almost all examples are similar and appear close to the center of the graph, where the height is highest. The more different an example is from the average, the less likely it is, giving the distinctive drop-off as the line flows away from the center. Human height is Normal distributed. Most men or women are the same height, and very short or very tall people are nearly equally rare. ↩
- 2. Calculated from the set of people with home equity and at least some investments. According to Forbes, in January of 2022 Musk’s fortune stood at $263 billion. ↩
- 3. As of 2022, 58% Americans have less than $5,000 in savings. ↩